
↵Open
Tresor AI changelog
Charts, right in the answer
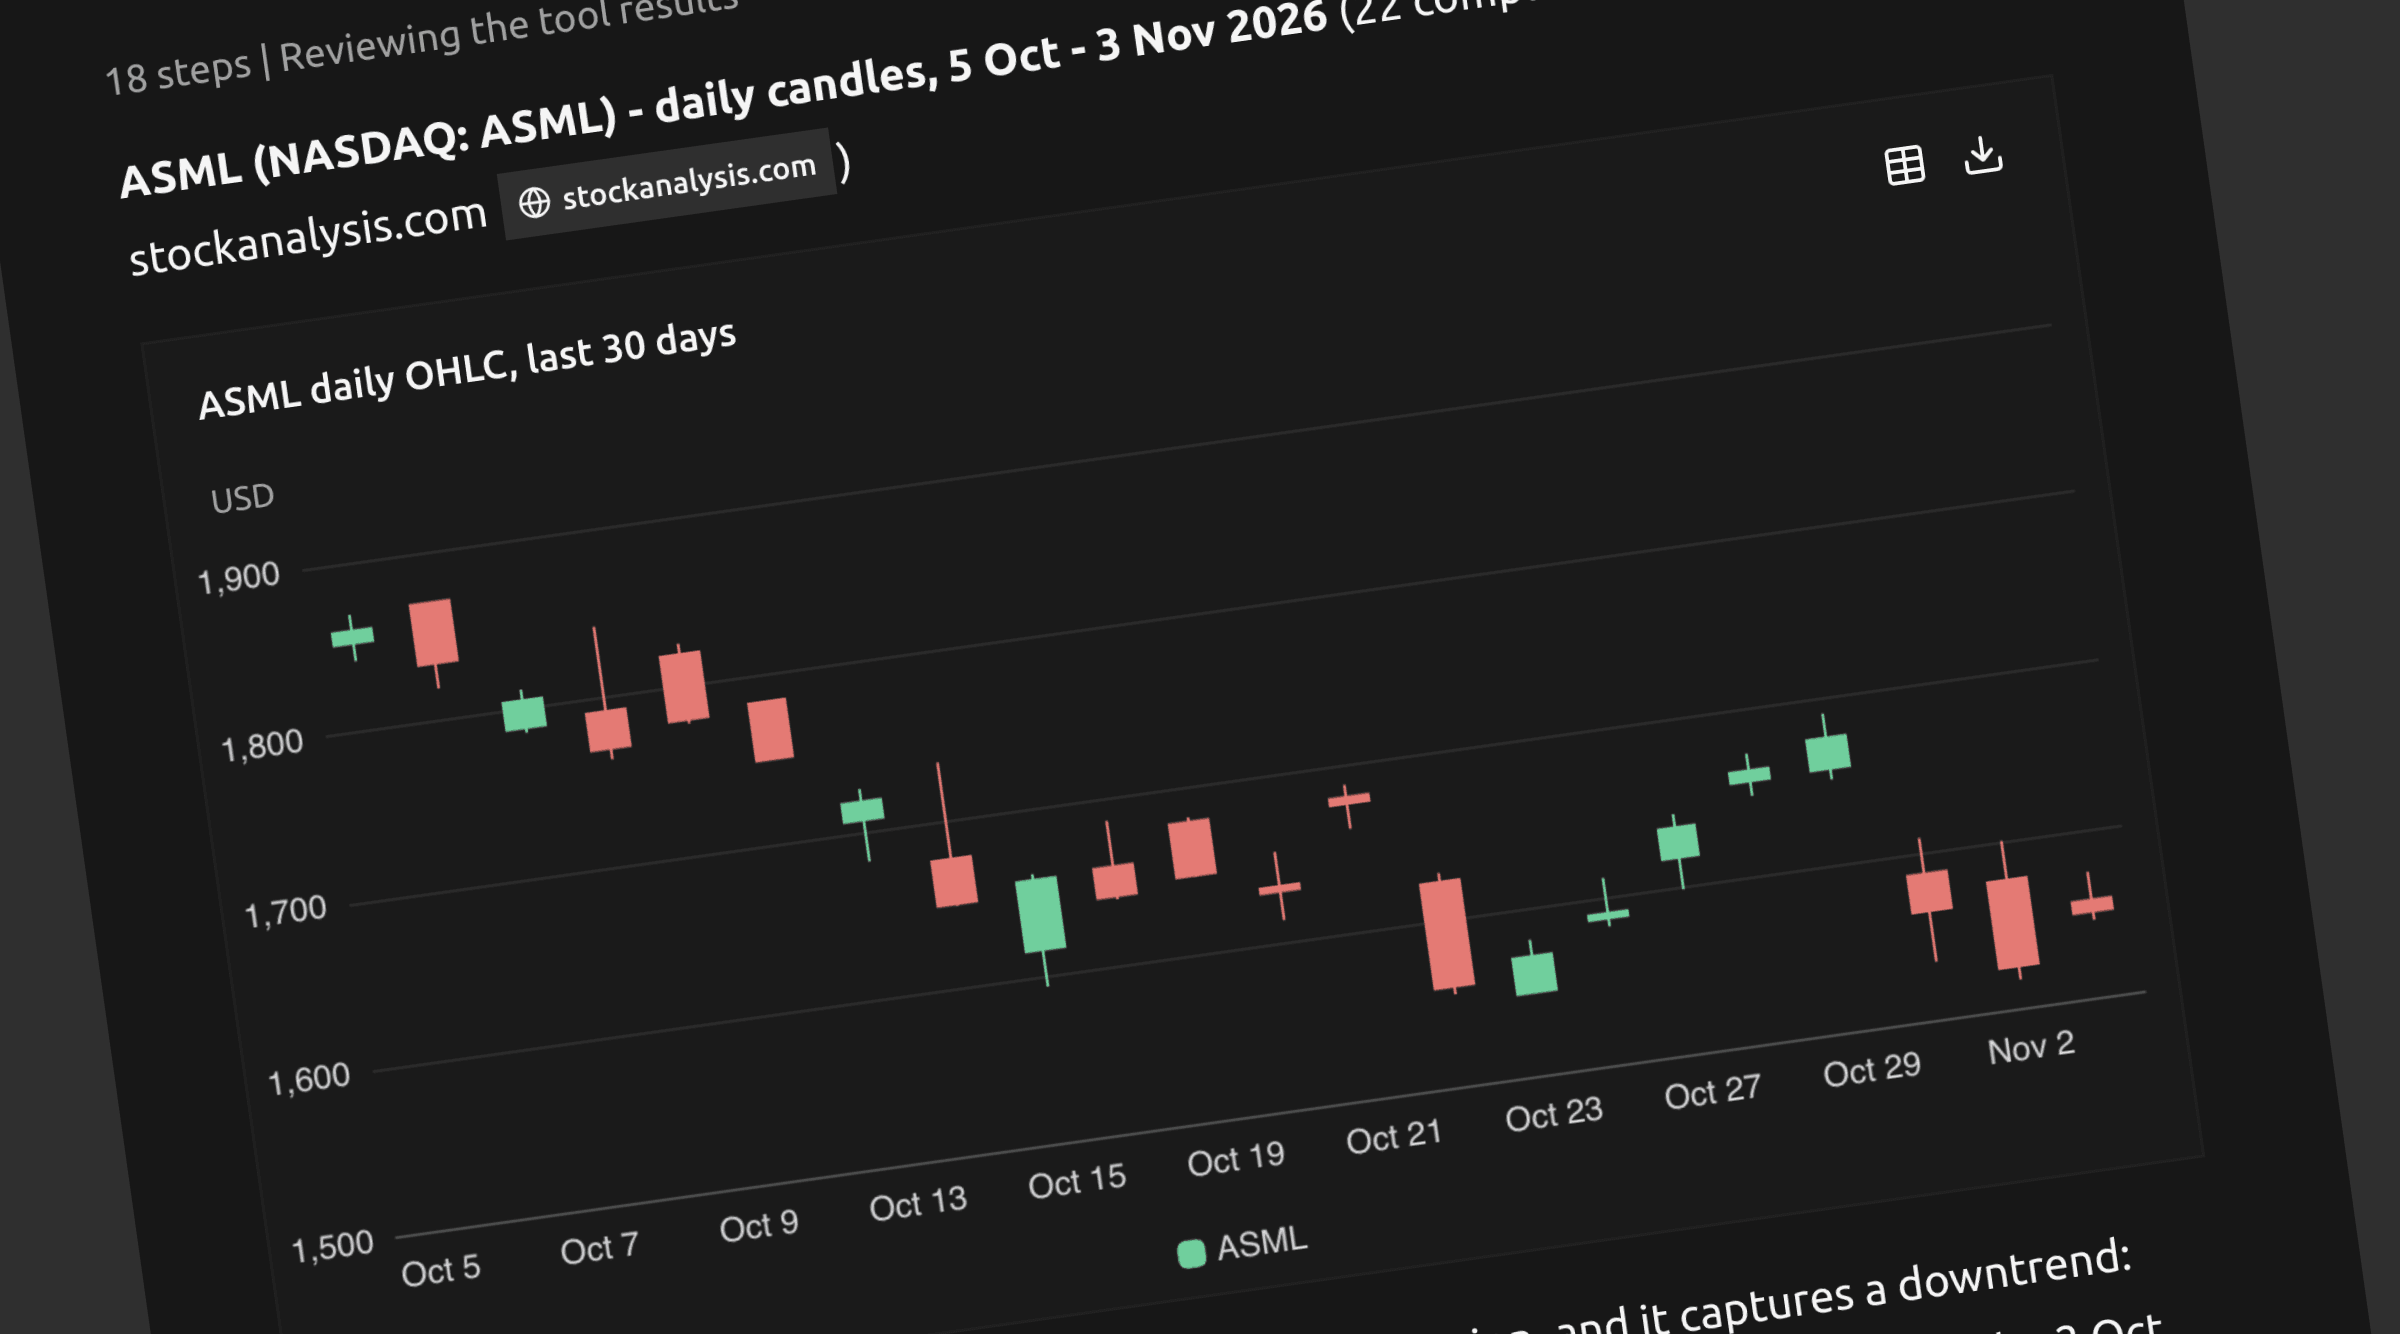
Some answers are easier to see than to read. Ask about a trend, a split or a comparison and Tresor now draws it — a chart card inside the answer, above the sentence that explains it.
Read the shape, then the numbers
Hover any point, bar or slice for the exact value and its unit. Select a legend entry to hide a series. Charts follow light and dark mode, and resize when you open the side panel.
Line, bar, pie, scatter, candlestick and many more are supported. You don't have to ask: when a trend or comparison is the answer, Tresor charts it. Ask for a different view and it draws that instead — asking is the editor.
Numbers you can take with you
The table button swaps the chart for the data behind it, and Copy CSV puts the same rows on your clipboard. Download saves the chart as a PNG, named after its title.
If a chart's data turns out to be unusable, you get the rows as a plain table — never a broken answer.
Next
Ask about something with a trend in it, then hover a point.